Posts

Showing posts from 2015

Web Performance, tell me the story

Image
Suppose you would like to know how your web site, behaves to clients from two different geo locations: for example, Finland and Ireland regarding response time. How quickly can you see and understand visually what's going on and how things are. Do you need to improve something ? Change your network provider ? Tune your application(s) ? Spend more money.  Start from a top level view, understanding the big picture and having the possibility to dive and analyze at the detail level.  Finally, can you visually tell the story of your web application as in a short chart ? Enter Kronometrix Web Performance ... Finland Something happened between 1:00 - 1:15 AM We can see more than one request affected by this event Overall we see all requests are executing fast, below 0.5 seconds And we have some exceptions, some are taking more than 0.5 seconds Ireland Same things from Ireland It is different, requests usually take longer to ex...

Web Performance subscription

Image
We been busy to add support for Web Performance to our appliance. That means anyone running any HTTP applications can send data to Kronometrix for analysis. Our idea of monitoring Web applications is a simple one: it starts from the operating system, HTTP server and the application itself. We report the most important metrics including the response times for the application. To make things even easier we wanted to add support for complete solution stacks, like  LAMP . (We still have lots of work to fully support them). And to have a complete picture of the Web service, we have introduced the workload management concept inside Kronometrix to gather and report data from one or many data sources and bound those to a SLA for upper management reporting. Nice and easy. Some first development snapshots from our implementation. Let's first switch to night mode, it is 23:10 here in Finland. So, here you go: All requests dashboard This shows a number of HTTP requests gathered as ...

60 messages per second

Image
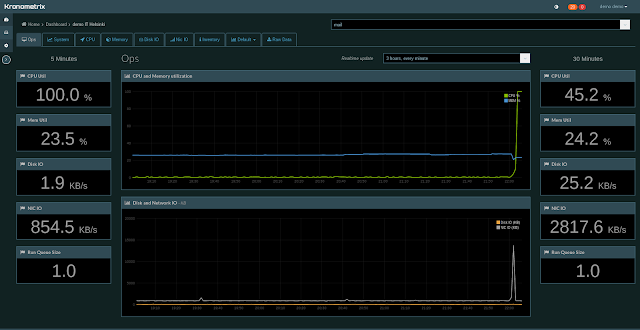
Kx 1.3.2 is our next release of Kronometrix for X64 platform.  Currently we are busy testing some new features in our QA environment. We are sending data from 750 data sources, data delivered by our DataCenter Simulator. Each system is delivering 5 messages.  Since yesterday we been processing more than 5 million messages at 60% usage. Appliance Usage These are the main screens within the appliance administration, which shows the utilization and throughput of our system in real-time. As well we include some other information about how many users, subscriptions and data messages etc we are processing.  and here the system utilization: This runs our latext Kronometrix on a *very* old hardware appliance, on purpose to test and stress our software on a bit older spec. Red and Blue pipelines working just fine.
Image
Kronometrix can consume events from different sources : IT computer systems, weather stations, loggers, applications in real-time. This means we can process and display data as soon as it arrives to our machinery.  And we can prepare the information for consumption to different dashboards, continuously. But not all data can be dispatched and displayed as soon as it arrives. Here is why and how we do it. The red (hot) pipeline Inside our kernel we process all incoming data, the raw data on a main line, the red pipeline. This is the most important pipeline within our kernel analytics. Here we transform raw data in statistics, like MAX, MIN, in AVGes for charting across different time intervals. All sorts of UI dashboards are attached to the red pipeline, to display data as immediate as it has been processed. On this line a high level of redundancy and efficiency is enforced. Here the kernel will spend as much as possible to filter and calculate things at a very fast rate s...

The STALL data filter

Image
Currently, Kronometrix, is supporting two types of raw data filters: the STALL and RANGE filters. A raw data filter is a mechanism to ensure that incoming raw data follows certain rules or conditions before the numerical processing and data visualization, within Kronometrix. For example the STALL filter will ensure raw data is properly arriving to our appliance and there are no delays. The RANGE filter, will ensure incoming raw data is sane and valid, and stays within certain range of values. For example the air temperature is valid as long as it is between -50C to 50C or the CPU Utilization of a Windows server is between 0 and 100%. The STALL Filter Defined under messages.json and part of the Library of Monitoring Objects , the STALL filter is part of the data message definition. For example this is the way to define the STALL for a data message, called sysrec, which belongs to a data source type: Linux (a computer system running Linux CentOS operating system).  stall...

Windows, Linux, FreeBSD all welcome

Image
By default for IT business, we support in Kronometrix, monitoring objects from Linux and FreeBSD data sources. Recently we been porting our data recorders to Windows operating system and start to offer ready made objects for this. Example, latest Kronometrix 1.2 we plan to support Linux, FreeBSD and Windows 2008, 2012 Server editions 64 bit. Below several data sources within Kronometrix: and then we can drill down per OS, example clicking centos : Thats all. This is part of executive dashboard view.

Programming Republic of Perl, the Windows story

Image
Task: port Kronometrix from Linux, FreeBSD to Windows platform, including all data recorders and the transporter. Preferable use a programming language, like Perl to easy the porting process and re-utilize whatever we have already in Kronometrix. Timeline:  ASAP Open Source: Yes Goals Some top rules for developing the new recorders: all recorders, must be coded in a scripting language preferable, all recorders must work as CLI and Windows services all raw data, should be easy to access, via C:\Kronometrix\log\ , no more mysteries about AppData directory transporter should be done similar way, coded using a scripting language memory footprint 64MB RAM Perl5 We been experimenting previously with C/C++ for Kronometrix on Windows. Nothing wrong with C/C++ except, that for every small change we had to do a lot of work & testing. We looked to PowerShell and other langauges but nothing came closer and felt like home, than Perl. All our data recorders...

Asus Zenbook UX32VD and FreeBSD 11, part two

Image
This is a short description how I got running FreeBSD 11-current on my Asus Zenbook UX32VD laptop. Im very happy with the current setup but of course it is room for improvements in many areas. Having DTrace, ZFS and the other goodies makes FreeBSD a real good candidate for a mobile environment. This is a short update, regarding a regression for Xorg and drm2 module which breaks down Xorg. Last Updated: 18 July 2015 Zenbook UX32VD Configuration CPU: Intel(R) Core(TM) i7-3517U CPU @ 1.90GHz Memory: 6 GB RAM Storage:  SanDisk SSD i100 24GB, Samsung SSD 840 PRO 500GB Video:  Intel HD Graphics 4000, Nvidia GT620M Display: 13" IPS Full HD anti-glare Wifi: Intel Centrino Advanced-N 6235 3 x USB 3.0 port(s)  1 x HDMI  1 x Mini VGA Port  1 x SD card reader Note: The laptop's internal hard drive, has been replaced by a Samsung SSD.

The Night Shift

Image
The TV Series ... Night Shift ? Nope, this is Kronometrix appliance for night workers, operators, sleepless system administrators and for the rest of us, working late. An appliance ? What do you mean ? To be serious about monitoring you better have an application running on a cloud platform, right ? Public or private, whatever that is, Google, Amazon, Azure or on a internal network powered by OpenStack, VMware ...  preferable deployed over a large number of nodes, using large memory configurations and offering advanced dashboards to keep track of hundreds of metrics collected from machines, storage, network devices, applications all available and ready to be ... read and digested by anyone. The duty admin is confused, what dashboards will be needed for basic performance monitoring and SLA and what metrics these dashboards should include ? We took a simpler approach with Kronometrix, which can be deployed on a cloud computing platform if really needed, which was designed ...

One Tool to rule them all ...

Image
Data Recording Module -  Five default, main, data recorders, written in Perl 5, responsible to collect and report: overall system utilization and queuing , per-CPU statistics , per disk IO throughput and errors , per NIC IO throughput and the computer system inventory data: sysrec, cpurec, diskrec, nicrec and hdwrec. But why not having a single process, simple to start and stop, and operate ? Does it matter, anyway ? One tool cannot perform all jobs. We believe that. We have assigned different tasks to different recorders, making easy and simple to update a data recorder without breaking the others. As well, we wanted to separate functionality based on the main 4 system's resources: CPU, Memory, Disk and Network. Additional we think it is very important to have a description of the hardware and software running on that computer system, sort of the inventory, that everybody understands easily what are we looking at. Saying these, we ended up using the fol...

Who are you ? The story about DBus and cloning virtual machines

Image
Kronometrix Data Recording Module , ships with a transport utility called sender , which ensures all raw data is shipped to one or many data analytic appliances over HTTP or HTTPS protocols.  sender,  a Perl5 citizen, checks all raw data updates and relies on a host uuid identifier from the operating system to deliver that raw data. If such host uuid is found will use that for the entire duration of its execution. If no such host uuid is found it will generate a new one and store that on its configuration file, kronometrix.json. The analytics appliance, relies that each data source is unique and valid, properly checked or generated by the transport utility, sender.  But what's happening if this really does not work ? Data Source Id Kronometrix uses the data source id concept, ( DSID ), to identify a data source point, from where one or many data messages are received. For example for IT, Computer Performance data, a DSID identifies to a computer system ho...

Kronometrix Analytics Appliance: Xen vs ESXi

Image
Latest Update: Tue May  5 15:54:10 EEST 2015 We heavily use Redis as part of our Kronometrix analytics software. For those which do not know what Redis is, see here . Recently we have upgraded our kernel from Redis 2.8.x branch to 3.x, latest release. And we were curious to see what sort of improvements and how latest Redis release works for our application in regard with ESXi and Xen. As already said, Kronometrix Appliance can works as a: physical appliance, operating system + analytics software on bare metal virtual appliance, running as one or many virtual machines within Xen or ESXi We are planning to check the redis-server proces utilization, extract a stack trace for the redis-server on both hypervisors. Xen Kronometrix 1.0.0 on Xen Generic X86_64 Server Ubuntu Server 12.04.5 LTS, Xen 4.2.2 amd64 1 x Intel(R) Core(TM) i7 CPU 930 @ 2.80GHz Hyperthreading: Available, ON 24 GB RAM 1 TB internal storage for dom0, 2TB NAS for domU ...

The Appliance ...

Image
Our analytic software, Kronometrix , runs on top of an operating system, tuned and configured for data analysis, bundled as a ready image, which can be downloaded and installed. The idea is simple, we wanted to offer something which is already tested, tuned and configured for hundreds, thousands of data sources. We call this,  the K ronometrix Appliance  and we want it to be ready to: work with or without WAN connection work on batteries and solar panels handle large or small volume of data in real-time analyse data from different data sources, different industries have zero-administration and no maintenance be affordable   Memory it's the new hard disk  Another PHP or Java application on top of MySQL ? Or maybe PostgreSQL ? Right ? Boringggg. When we started Kronometrix , we basically cleaned the table and we wanted to see things aligned for future not 1978. The first thing, was where to store all the time series data and how to access t...

See it all: IT, Meteorology, Weather in a single package

Image
When we started to work on Kronometrix, we redefined our requirements such way, we would be able to process data from a computer system, a weather station, an environmental monitoring sensor or you name it ... as long as data will come as a time-series. And we did it: Information Technology, Aviation Meteorology and Weather data all on the same analytics software. Multiple data subscription within Kronometrix Thanks to our Library of Monitoring Objects we can easily plug into our software different objects to describe the real world and display it. And all these dashboards are available from a single click, as a simple Kronometrix user.

Kronometrix Data Recording 1.0 - Linux Edition

Kronometrix for Information Technology industry includes utilities to measure computer system performance. We are working heavily to expand this towards data center facility itself, and monitor the environment around data center: cooling devices, air temperature and pressure, humidity, smoke and other important metrics. Kronometrix includes two main things: data recording module data analytics module Kronometrix 1.0 supports two main flavors of linux based systems: CentOS and Debian. We build our packages on CentOS 5 and Debian 7 32 and 64bit versions. Additional we are providing support for ARM, the Raspbian operating system for Raspberry Pi hardware. To make things simpler we have packaged all software as rpm and deb package formats and all initial required steps are included in these packages. Package Content Kronometrix 1.0 Linux edition contains, all data records, the transport utility and additional weather data recorders. along with these come the manual pages a...

The son of the shoemaker has no shoes

Image
Everybody knows Google's Page Speed testing tool. Well, at least I was thinking so. Today I wanted to see how www.kronometrix.org was doing against PageSpeed, looking particular how fast, optimized my site was using latest Bootstrap library and some fixes. Got something like: Mobile 64/100, Desktop 93/100. Not bad. See below: Google PageSpeed  Then I wanted to see how my site compared against bigger names from Finnish IT industry, like Tieto, IBM, Oracle, SuperCell, Rovio, SSH, F-Secure for example. Results are wow ... maybe these guys haven't heard of Google PageSpeed, or don't know how their main site really works. One might argue that PageSpeed is not useful nor bring any value directly, but in fact it does list and analyze some very important parts that any web site should properly implement and support: HTTP Compression Server Response times Image compression HTML, CSS, JS optimizations Client: Firefox 34.0.5 FreeBSD amd64. Note: This wa...