The Night Shift
The TV Series ... Night Shift ? Nope, this is Kronometrix appliance for night workers, operators, sleepless system administrators and for the rest of us, working late. An appliance ? What do you mean ?
To be serious about monitoring you better have an application running on a cloud platform, right ? Public or private, whatever that is, Google, Amazon, Azure or on a internal network powered by OpenStack, VMware ... preferable deployed over a large number of nodes, using large memory configurations and offering advanced dashboards to keep track of hundreds of metrics collected from machines, storage, network devices, applications all available and ready to be ... read and digested by anyone.
The duty admin is confused, what dashboards will be needed for basic performance monitoring and SLA and what metrics these dashboards should include ?
We took a simpler approach with Kronometrix, which can be deployed on a cloud computing platform if really needed, which was designed to be:
- easy to install, manage and administer, aiming for zero-administration
- ready for computer performance analysis, including essential performance metrics
- self maintained and automated, majority of tasks are pre-configured and already set
- simple to read and understand using clear UI dashboards
- available for operation people, ready for large size screens, example 51"
Night Mode
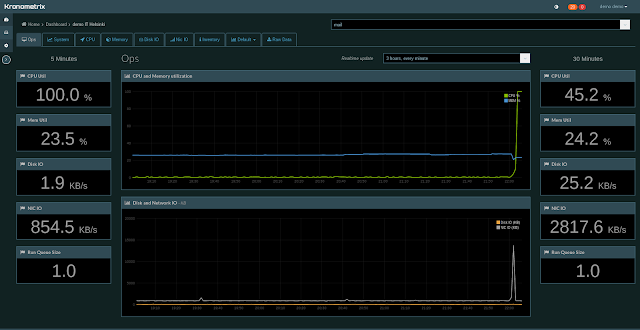
Lights off please. A simple Ops Dashboard, designed to display vital performance indicators, CPU, Memory, Disk IO and NIC IO utilization, for a host, on two time ranges: 5 and 30 minutes along with the system run queue length. On same dashboard, central we display same time series data, but represented as a chart on different time resolutions. A very simple control let us put the dashboard for night monitoring mode.
 |
| Operational Dashboard, 5 and 30 minutes |
Night Mode, Zoom-In
 |
| Operational Dashboard 5 and 30 minutes, zoom in |
Kronometrix Advantages
- top essential performance metrics, per host, included
- clear and simple UI, no confusing labels, charts, extra information
- two time ranges, allowing operators, sysadmins to check current and past activities
- possibility to drill and zoom in, using the time series data charts
- direct link to console events, alerts and thresholds
- designed for large size screens, eq. 51", on night and day mode


Comments
Post a Comment